Prediction
This is the work flow of the gene cluster detection and scaffold pipeline.
Gene prediction
If only DNA data is provided, the genes are predicted using Prodigal. If the genes are already assigned, SeMPI can try to parse the genes and use them for further analysis.
Domain detection
The detection of relevant domains in the predicted proteins is performed using profile hidden Markov models (profile-HMMs) created with HMMER 3.0. The detected domains are shown in Table 1. Since the profile-HMMs are derived and modified from the MIBiG 2 database, the nomenclature is mainly based on the antiSMAHS definition as described in their documentation.
| Domain | Full name | F1-score | HMM detection threshold (domT) |
|---|---|---|---|
| ACP | Acyl carrier protein | 0.96 | 13.9 |
| AT | Acyltransferase | 1 | 47.4 |
| A | Adenylation domain | 1 | 19.6 |
| CAL | Coenzyme A ligase | 0.94 | 221.8 |
| C | Condensation domain | 1 | 25.9 |
| DH2 | Dehydratase | 0.98 | 33.2 |
| DH | Dehydratase | 0.99 | 31.1 |
| DHt | Dehydratase | 0.88 | 44.3 |
| ER | Enoylreductase | 1 | 68.8 |
| E | Epimerization domain | 1 | 60.4 |
| KR | Ketoreductase | 1 | 20 |
| KS | Keto-synthase | 1 | 72 |
| PCP | Peptide carrier protein | 0.97 | 21.9 |
| TD | Reductive Thioesterase | 1 | 42.1 |
| TE | Thioesterase | 1 | 36.5 |
| bACP | β-branching acyl carrier protein | 0.59 | 28.9 |
| cMT | C-Methyltransferase | 1 | 104.7 |
| nMT | N-Methyltransferase | 0.99 | 42.7 |
| oMT | O-Methyltransferase | 0.99 | 70.6 |
| tATd | Trans-acyltransferase docking domain | 0.98 | 50 |
Gene cluster curation
After the protein detection the genome is converted into a DataFrame pandas, which simplifies the subsequent operations. Additional, pandas allows to apply vectorized functions, which speeds up the prediction pipeline. A mysql dump of the DataFrames is provided with the final output.
The DataFrame is curated and modified in order to prepare the BGC module detection (see Example Fig. 8).
- Close genes (the threshold can be set in the options of the Upload form) which encode proteins on the same strand are combined into blocks. A detailed observation of the MIBiG annotated NRP and PK clusters showed, that for this condition the co-linearity principle applies for the very most cases.
- The domains are ordered based on the occurrence in the genome (id), but for module assignment it is more useful to order the domains based on the occurrence in the block, therefore an additional index is assigned based on the block order (Corr. id).
- In very rare cases the detected protein domains overlap. This can be the case especially for very short sequences (for example the ACP domain). If the domains overlap to more then 20% the domain with the lower bitscore (see HMMER) is removed.
- Sometimes the HMM algorithm detects two domains in succession instead of one domain, these domains are automatically joined to one domain.

Fig. 8 Curation steps: (a) Block generation, (b) Domain reordering, (c) Domain overlap removal, (d) Domain duplication joining.
Module detection
SeMPI v2 detects functional PKS and NRPS modules based on a in-depth analysis of known gene clusters stored in the MIBiG 2.0. The modules can be be observed either in the tabular representation (see Example Fig. 9) of the domains of a gene cluster or in the interactive cluster browser (see Example Fig. 10).
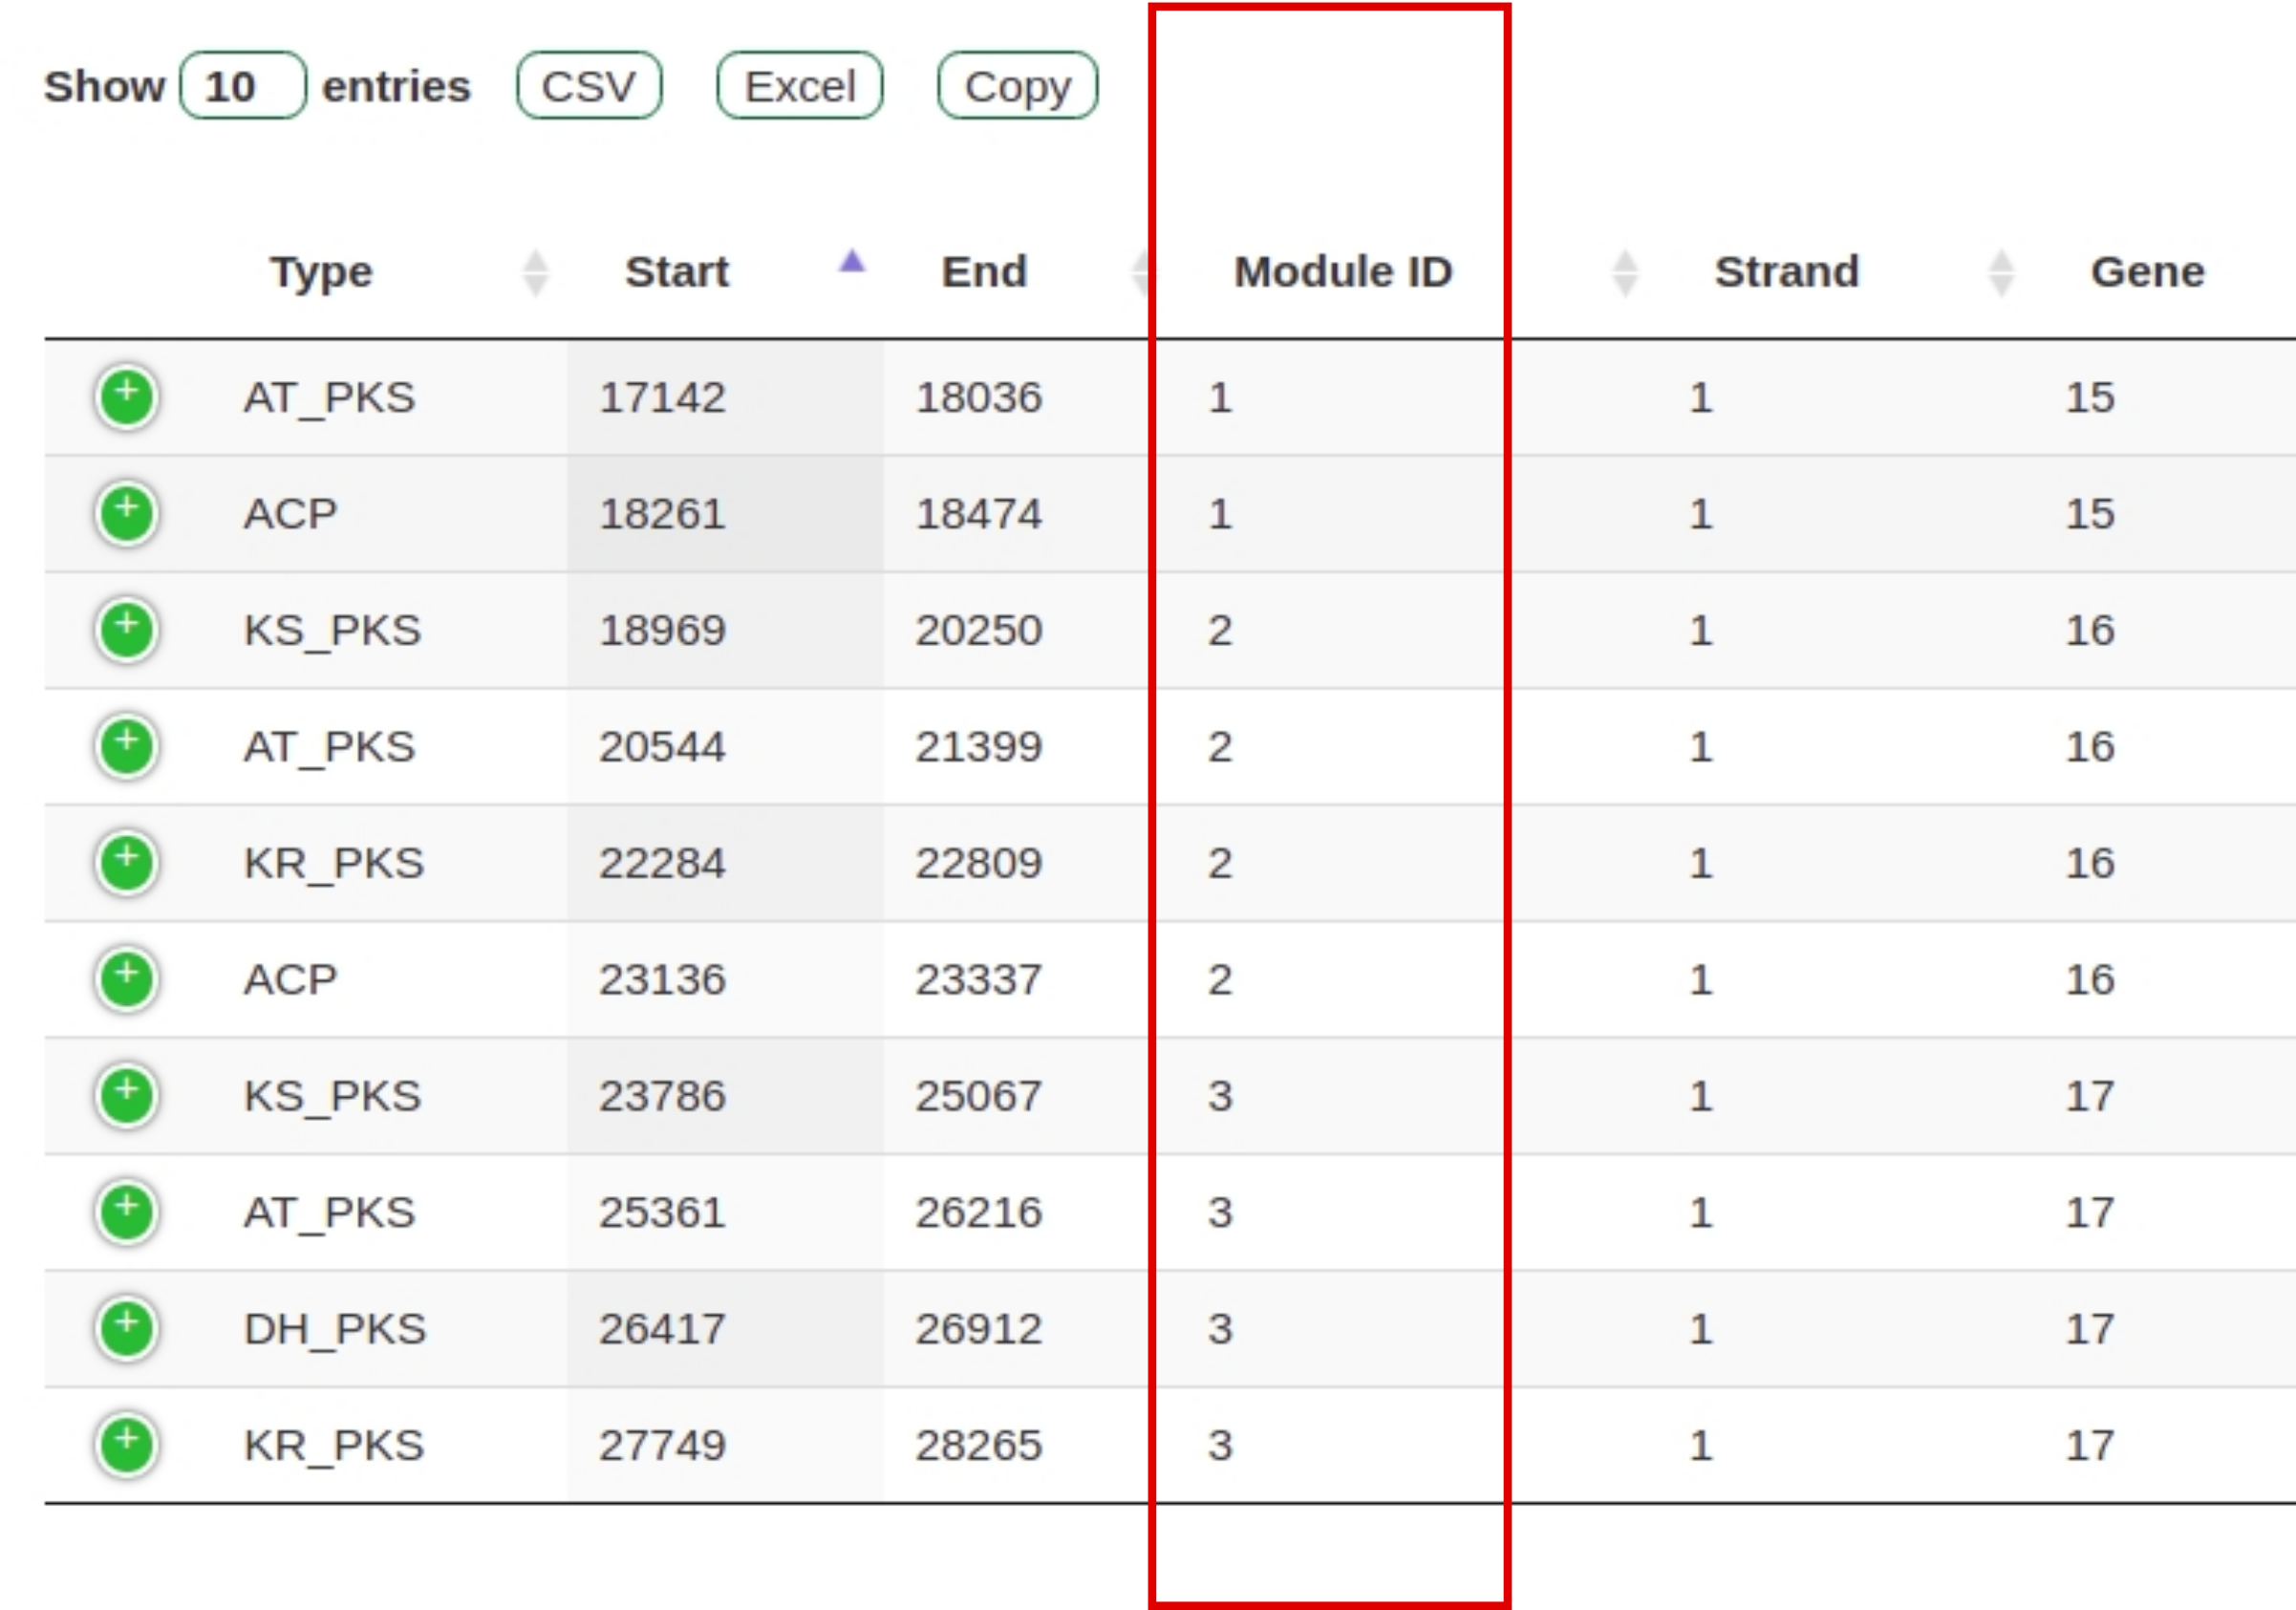
Fig. 9 Tabular domain representation of a gene cluster with modules highlighted in red.
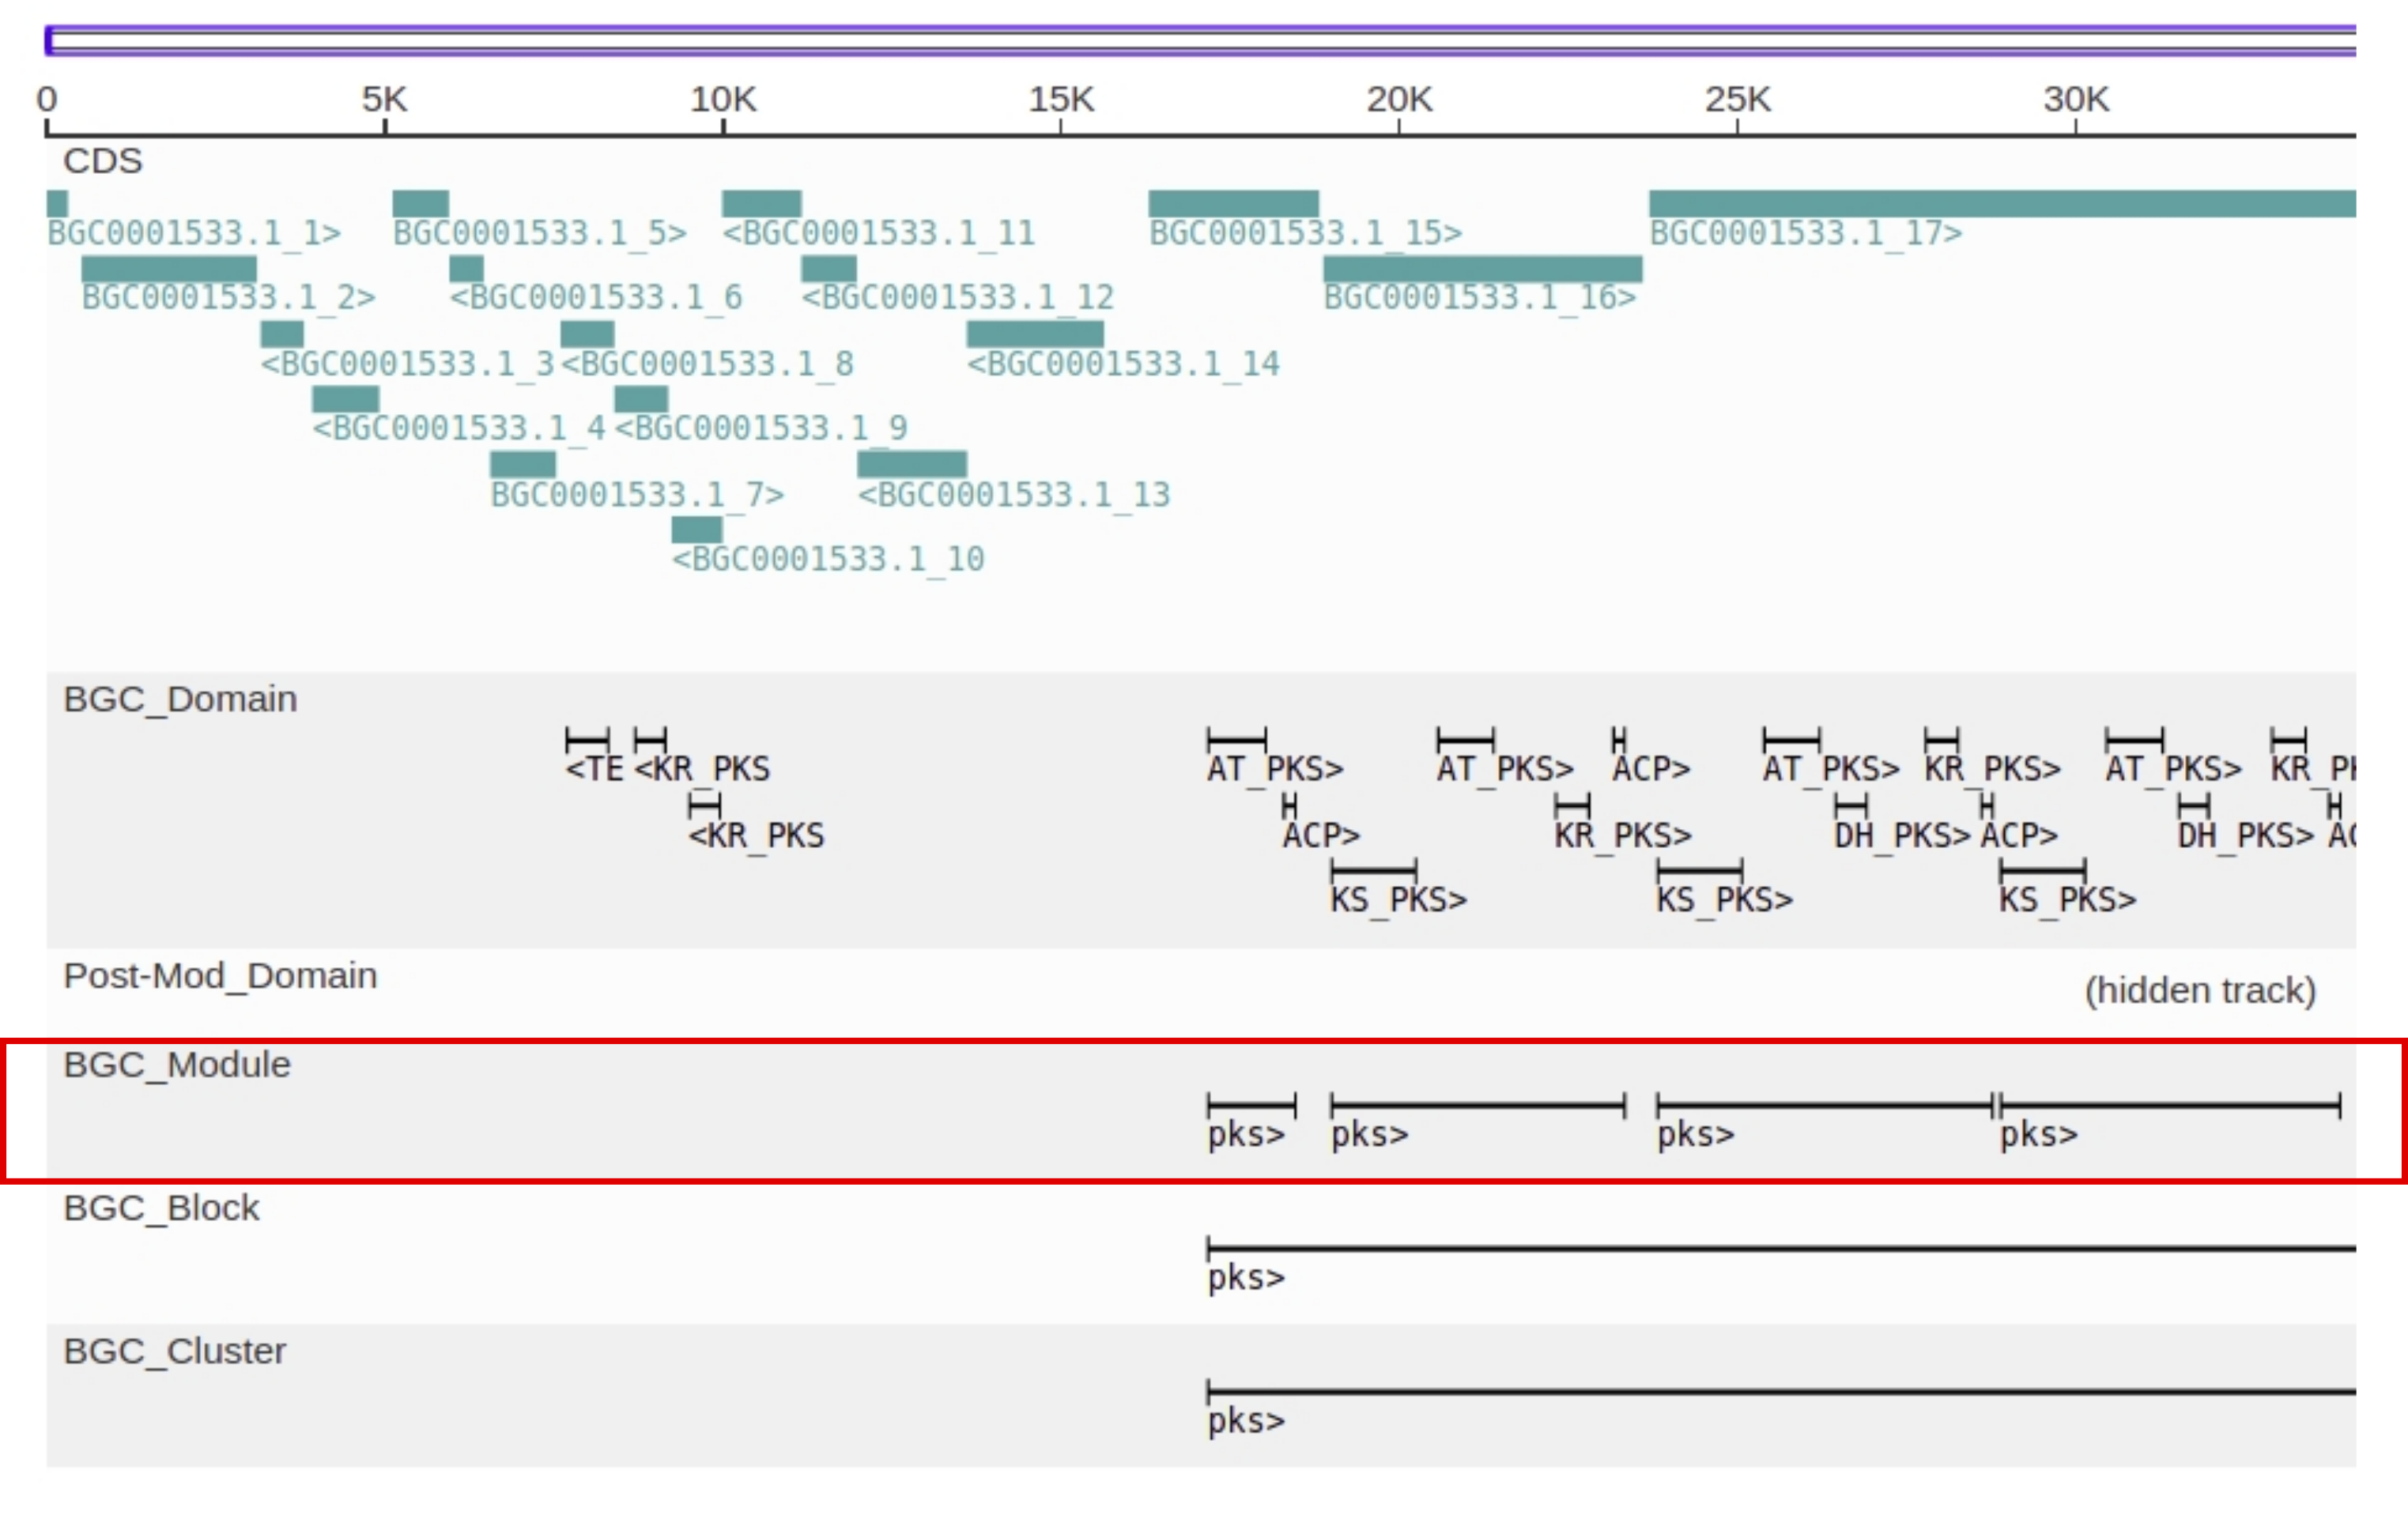
Fig. 10 Cluster browser representation of a gene cluster with modules highlighted in red.
Assembly logic for disjointed gene clusters
If the domains are not organized in a single consecutive block an module ordering algorithm is applied. In most cases (<= 3 blocks) the assignment of starting modules to the beginning and terminal modules to the end of an gene cluster is sufficient for a correct module order. For gene clusters with more than 3 blocks the modules are ordered based on comparison of the gene cluster assembly with the set-up of more than 250 reference gene clusters where the module order is known.
Postsynthetic modifications
In order to detect postsynthetic modifications additional Pfam domains are detected in proximity of the gene cluster. The Pfam domains are correlated to specific postsynthetic modifications as shown in Table 2.
| Postsynthetic modification | Pfam ID | Description | Correlation |
|---|---|---|---|
| Glyco | PF00908.16 | dTDP-4-dehydrorhamnose 3,5-epimerase | 0.67 |
| Glyco | PF01370.20 | NAD dependent epimerase/dehydratase family | 0.64 |
| Glyco | PF03559.13 | NDP-hexose 2,3-dehydratase | 0.61 |
| Glyco | PF00201.17 | UDP-glucoronosyl and UDP-glucosyl transferase | 0.59 |
| Glyco | PF03033.19 | Glycosyltransferase family 28 N-terminal domain | 0.56 |
| Glyco | PF01041.16 | DegT/DnrJ/EryC1/StrS aminotransferase family | 0.52 |
| Glyco | PF08421.10 | Putative zinc binding domain | 0.47 |
| Glyco | PF16363.4 | GDP-mannose 4,6 dehydratase | 0.44 |
| Glyco | PF04101.15 | Glycosyltransferase family 28 C-terminal domain | 0.28 |
| Glyco | PF01075.16 | Glycosyltransferase family 9 (heptosyltransferase) | 0.21 |
| Glyco | PF00728.21 | Glycosyl hydrolase family 20, catalytic domain | 0.18 |
| Glyco | PF02838.14 | Glycosyl hydrolase family 20, domain 2 | 0.18 |
| Glyco | PF01915.21 | Glycosyl hydrolase family 3 C-terminal domain | 0.13 |
| Glyco | PF00933.20 | Glycosyl hydrolase family 3 N terminal domain | 0.13 |
| Glyco | PF14885.5 | Hypothetical glycosyl hydrolase family 15 | 0.1 |
| Cl | PF04820.13 | Tryptophan halogenase | 0.66 |
| Cl | PF00999.20 | Sodium/hydrogen exchanger family | 0.51 |
| Sphingo | PF12680.6 | SnoaL-like domain | 0.61 |
| Sphingo | PF00890.23 | FAD binding domain | 0.54 |
| SS | PF07992.13 | Pyridine nucleotide-disulphide oxidoreductase | 0.46 |
| NO2 | PF01678.18 | Diaminopimelate epimerase | 0.67 |
| 6-Ring | PF16197.4 | Ketoacyl-synthetase C-terminal extension | 0.53 |
| 6-Ring | PF02801.21 | Beta-ketoacyl synthase, C-terminal domain | 0.52 |
| 6-Ring | PF08990.10 | Erythronolide synthase docking | 0.51 |
| 6-Ring | PF00743.18 | Flavin-binding monooxygenase-like | 0.46 |
| 6-Ring | PF13377.5 | Periplasmic binding protein-like domain | 0.23 |
| 6-Ring | PF13191.5 | AAA ATPase domain | 0.23 |
| 5-Ring | PF12680.6 | SnoaL-like domain | 0.56 |
| 5-Ring | PF00890.23 | FAD binding domain | 0.53 |
| 5-Ring | PF01551.21 | Peptidase family M23 | 0.46 |
| 5-Ring | PF08990.10 | Erythronolide synthase docking | 0.45 |
| 5-Ring | PF00486.27 | Transcriptional regulatory protein, C terminal | 0.26 |
| 5-Ring | PF16197.4 | Ketoacyl-synthetase C-terminal extension | 0.26 |
| 5-Ring | PF00109.25 | Beta-ketoacyl synthase, N-terminal domain | 0.25 |
Based on the detected domains the postsynthetic modifications are predicted using regression models. The predicted numbers of postsynthetic modifications are shown together with the predicted scaffold as shown in Fig. 11.
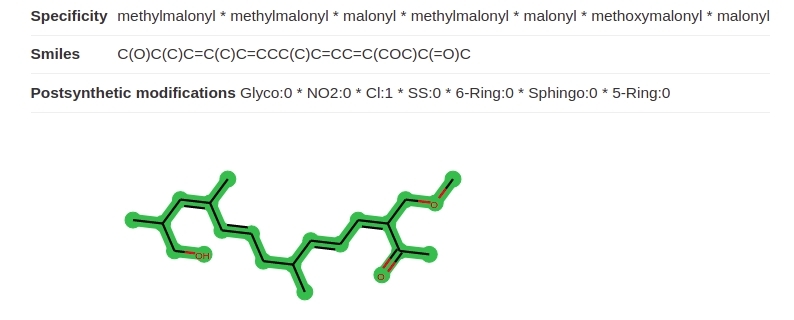
Fig. 11 Example of an PK scaffold prediction with indicated halogen (Cl) postsynthetic modification.
Scaffold generation
The scaffolds are generated by joining of each building block of a gene cluster. If the modules of a cluster cannot be joined multiple blocks are generated (see Example Fig. 12). The database screening queries all blocks in the target molecules (see Example Fig. 13). The example is taken from BGC0000317. The multiple blocks scaffoled scoring algorithm is further described in Combined score ranking.
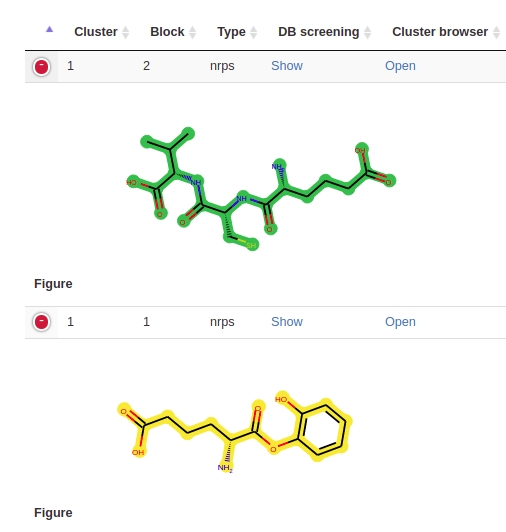
Fig. 12 Two blocks predicted for one cluster.
Fig. 13 Both blocks are screened in each of the target compounds.